Cowboy Debugging Python Memory Leaks
When working on a live system, the feedback loop can be pretty tricky. You don't want to entirely suspend a system, but you really want to get the info out of the system.
Memory leaks in particular can be a nightmare, because they can take a while to show up and, definitionally, won't survive a process restart.
Let's talk about debugging memory leaks.
objgraph is a great library to get a birds-eye view of whats in your memory.
print("Showing growth...")
objgraph.show_growth()
print("...end showing growth")
The following snippet run once will give you a summary of what the most popular types are in memory
Showing growth...
dict                          18098    +18098
tuple                         16317    +16317
function                      15662    +15662
list                           5963     +5963
ReferenceType                  5494     +5494
builtin_function_or_method     3004     +3004
cell                           2903     +2903
type                           2409     +2409
getset_descriptor              2379     +2379
frozenset                      1607     +1607
...end showing growth
This result is saved off in the library by default. When we run it a second time we'll see the difference in top-line counts compared to the last call to show_growth (or to growth, the undlerying function that just counts without printing a result).
# we can call growth to avoid the initial print call
objgraph.growth()
... # do a bunch of stuff
objgraph.show_growth()
Showing growth...
dict                          18554      +455
list                           5969        +5
SomeRef                           9        +4
tuple                         16319        +2
method                          251        +2
builtin_function_or_method     3006        +1
BufferedReader                    2        +1
Handle                            4        +1
HttpRequest                       1        +1
Message                           1        +1
...end showing growth
The above shows that before doing a bunch of stuff, 5964 lists were in memory. After doing things, 5969 lists were in memory. There are 5 more lists in memory after than before.
This doesn't mean that 5 new lists were allocated. We could have allocated 50 new lists while deallocating 45 other lists! But if we're looking at a system where we expect no leakage, even seeing 5 extra lists can be cause for concern at certain time scales. After all, those lists are potentially leaking everything they are holding onto!
Armed with a way to at least peek at the contents of memory, you now need a way to tell your system to actually do the peeking.
And unsatisfying way you could do this with a Django app:
def memory_view(request):
   growth_str = io.StringIO()
   objgraph.show_growth(file=growth_str)
   return Response(text=growth_str.content)
And add a URL that routes to this view so you can trigger it. And if you wanted to inspect a background worker, now you're adding a new task and messing with that as well!
This sort of messing around to press a metaphorical button has always left me emotionally unsatisfied.
Instead, I reach for signals.
import signal
import objgraph

def check_memory(signum, frame):
    try:
        print("DBG>>")
        objgraph.show_growth()
        print("<<DBG")
    except Exception as exc:
        print("HIT EXCEPTION IN DEBUG SCRIPT")
        print(exc)


signal.signal(signal.SIGUSR1, check_memory)
If you stick this somewhere in your program, you will have a signal handler that will spit out memory growht since the last time it received the USR1 signal.
This includes a catch-all exception handler just to make sure you don't accidentally tear down your whole app due to some bug in your debugging code. Nothing like having a system crash due to some incidental issue when trying to collect performance data!
Signal handlers are an easy way to trigger ad-hoc behavior in a program, without having to touch the rest of your program
Once you have a signal handler set up in your program, there's a question of sending that signal.
If you know the process ID, then kill -sUSR1 $pid will trigger the above signal handler.
How can you find the process ID? ps aux | grep python should give you a view of python processes running on your machine (ps aux will show you the entire command with arguments to help you figure out which ones is yours).
pgrep python gets you there faster, but will only look at the command, not the arguments. For something like fastapi or manage.py (Django) you'll want to do pgrep -f manage.py
And if you're confident your filter is going to hit the right process, you can just go for it with a call to pkill -sUSR1 -f manage.py. And if you hit your target, you should see something in whatever log you're looking at (including potentially just another tab in your terminal).
So at this point your workflow is:
pkill -sUSR1 -f manage.py
# ... wait a bit for memory to leak
pkill -sUSR1 -f manage.py
At which point you should see memory growth in your real system.
If you're lucky you might end up running your program and finding that only a few types of objects are showing up.
DBG>>
Showing growth...
list        5964        +1
dict       18099        +1
SomeRef       18        +1
...end showing growth
<<DBG
In my case, SomeRef stands out as a class that I know about. So I will focus on why I am having leaks for that type.
A couple tools from objgraph are helpful here.
ref_objs = objgraph.by_type("SomeRef")
objgraph.by_type lets you get all the objects of a certain type (more precisely, whose class has a given name).
If you think that some objects of a type are leaking, you can ask objgraph to graph this out for you.
import random
ref_objs = objgraph.by_type("SomeRef")
random_ref_obj = random.choice(ref_objs)

# get a backreference chain to our object
# (i.e. a path to our object that would prevent
#  this object from being garbage collected)
backref_chain = objgraph.find_backref_chain(
  random_ref_obj,
  objgraph.is_proper_module
)
# show this chain by graphing it out
objgraph.show_chain(backref_chain, filename='chain.png')
The core functions here:
objgraph.by_typereturns a list of all objects whose class name matches the argument. At least the objects that are tracked by the GC (this won't let you find all theints lying about)objgraph.find_backref_chaintakes an object and then finds a "path to it", a list of objects that guide us to the object.objgraph.show_chainvisualizes this chain.
For example if I have:
import objgraph

global_data = {"a": [1, 2, 3]}


def do_thing():
    leaking_dict = {}
    global_data["a"].append(leaking_dict)
    return leaking_dict


def look_for_leak():
    suspicious = do_thing()
    backref_chain = objgraph.find_backref_chain(
      suspicious,
      objgraph.is_proper_module
    )
    objgraph.show_chain(backref_chain, filename="chain-inner.png")
Then you'll get the following out from this:
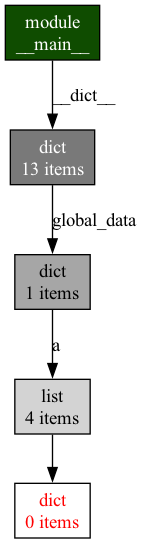
You can see that do_thing's return value is also being stored into global_data, and so is accessible in a way that would prevent it from being collected. While it's possible we are actually using this data, in essence this could likely just be a leak.
objgraph.get_leaking_objects in the documentation. This will give a list of objects who have no referents yet aren't collected. These objects are theoretically permanently leaked. This can happen with issues in C code, but it's very unlikely for Python code to get here.
I have failed to successfully use the results of this to find memory issues. You might have better luck than me, but I have decided it's rarely important
In many example scripts for objgraph a random element from objgraph.by_type is taken and inspected. If you're lucky, that random element wl
If you're unlucky you'll be trawling through plenty of objects that aren't actually leaking. If you have thousands of objects and only a handful that are problematic, you're not going to see what you want.
What I do in these circumstances doesn't scale well, but can be helpful.
old_refs = None

def look_for_leak():
  global old_refs
  if old_refs is None:
    old_refs = set(objgraph.by_type("SomeRef"))
  all_refs = set(objgraph.by_type("SomeRef"))
  new_refs = all_refs - old_refs
  print(f"Found {len(new_refs)} new refs...")
  if len(new_refs) > 0:
    print("Drawing  a random backref chain...")
    objgraph.show_chain(
        objgraph.find_backref_chain(
          new_refs.pop(),
          objgraph.is_proper_module
        ),
        filename="backref.png",
    )
  old_refs = new_refs
When look_for_leak is called, it checks for which SomeRefs are here that weren't there in the previous iteration. This lets me focus on these new objects.
Combining this with the manual signal handler approach, along with being pretty fast, and it's more likely you will be looking at somethign relevant.
It must be said that holding onto references through old_refs will prevent collection, so this is very much in cowboy territory. I'm still only doing this manually with a signal. This code costs nothing without the signal.
When working on big enough problems, you might find yourself having to tweak this kind of script to really dig into items that care. But since it's all Python, you have rich type information all over the place to help you out.
While working on these problems, I find it pretty tedious to restart the system over and over to figure things out.
Here's what my actual signal handler looks like when working on things locally:
import signal


debug_data = {}


def run_debug_script(signum, frame):
    try:
        print("DBG>>")
        exec(
          open("./debug_script.py").read(),
          globals(),
          {"data": debug_data}
        )
        print("<<DBG")
    except Exception as exc:
        print("HIT EXCEPTION IN DEBUG SCRIPT")
        print(exc)


signal.signal(signal.SIGUSR1, run_debug_script)
I write up logic for checking out memory issues into a script called debug_script.py. When I send USR1 to the process, it loads it up and runs it in.
I can look at objects of one type, change up my script, save it and then send the signal again, without tearing down the system.
The debug_data global is there to give me some notion of persistence across signal handling events. Within my script, data persists between runs.
A simple toy use case is just having a run count:
data.setdefault("run_count", 0)
# ...
data["run_count"] += 1
print(f"(run count: {data['run_count']})")
But in this case I used it to hold my set of old references:
if "prev_refs" not in data:
    data["prev_refs"] = set(objgraph.by_type("SomeRef"))
cur_refs = set(objgraph.by_type("SomeRef"))

new_refs = cur_refs - data["prev_refs"]
print(f"Found {len(new_refs)} new refs...")
if len(new_refs) > 0:
    print("Drawing  a random backref chain...")
    objgraph.show_chain(
        objgraph.find_backref_chain(
          new_refs.pop(),
          objgraph.is_proper_module
        ),
        filename="backref.png",
    )

data["prev_refs"] = cur_refs
Having a separate script that gets re-read throughout my debugging session lets me keep the system alive and test out theories. But it is the ultimate in cowboy coding: the data I'm holding onto affects what I'm measuring, I could easily modify running data and break the system with a call to sys.exit.
But so long as you can walk the tightrope of holding all the various changes you are making to your script to manage the state, you can iterate quite quickly with this trick.