How I Tried To Reduce Pylint Memory Usage
Through work I have to deal with a pretty huge codebase, and run Pylint on it during our continuous integration process. It's always been a bit slow, but recently I also noticed that it was consuming a lot of memory, causing OOM failures if we tried to run it too much in parallel.
I decided to roll up my sleeves and figure out:
- What exactly was consuming so much memory?
- Is there a way to avoid doing this?
This is a log of how I went about these two questions, as future reference for when I do other profiling work in Python.
Looking at Pylint from the entrypoint(pylint/__main__.py), I end up digging downwards and finding the "quintessential" for loop that you would expect in a program that checks a bunch of files for errors:
#!python
def _check_files(self, get_ast, file_descrs):
        # in pylint/lint/pylinter.py
        with self._astroid_module_checker() as check_astroid_module:
            for name, filepath, modname in file_descrs:
                self._check_file(get_ast, check_astroid_module, name, filepath, modname)
First I just threw in a print("HI") statement in there to confirm that this is indeed what's being run when I do pylint my_code, and that goes off without a hitch.
First is to try and figure out what's being held in memory, so I do a really basic "heap dump" with heapy to see if anything stands out
#!python
from guppy import hpy
hp = hpy()
i = 0
for name, filepath, modname in file_descrs:
    self._check_file(get_ast, check_astroid_module, name, filepath, modname)
    i += 1
    if i % 10 == 0:
        print("HEAP")
        print(hp.heap())
    if i == 100:
        raise ValueError("Done")
My heap profiles end up being almost entirely "frame types" (which I was kind of expecting, for some reason), but also holding ont a bunch of tracebacks. Enough of these kinds of objects that I told myself "surely this is more than is needed".
#!text
Partition of a set of 2751394 objects. Total size = 436618350 bytes.
Index  Count   %     Size   % Cumulative  % Kind (class / dict of class)
    0 429084  16 220007072  50 220007072  50 types.FrameType
    1 535810  19 30005360   7 250012432  57 types.TracebackType
    2 516282  19 29719488   7 279731920  64 tuple
    3 101904   4 29004928   7 308736848  71 set
    4 185568   7 21556360   5 330293208  76 dict (no owner)
    5 206170   7 16304240   4 346597448  79 list
    6 117531   4  9998322   2 356595770  82 str
    7  38582   1  9661040   2 366256810  84 dict of astroid.node_classes.Name
    8  76755   3  6754440   2 373011250  85 tokenize.TokenInfo
It's at this point that I discovered heapy's Profile Browser, which seemed like a bit of a nicer way to look at this data
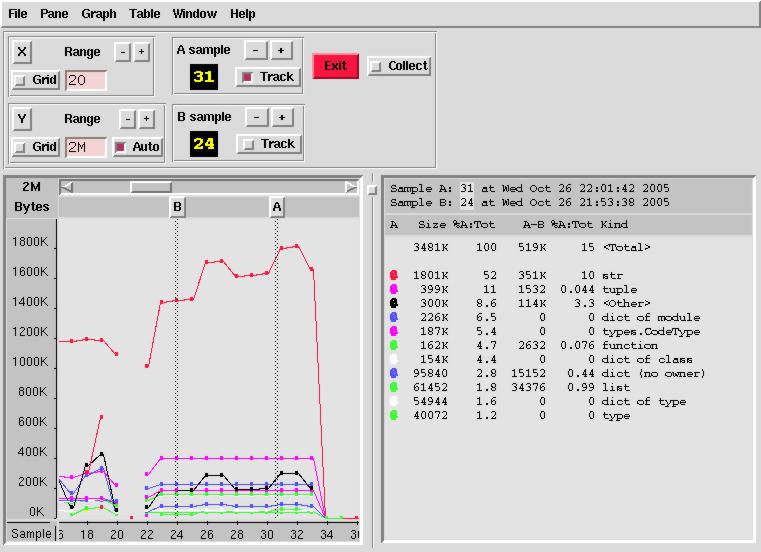
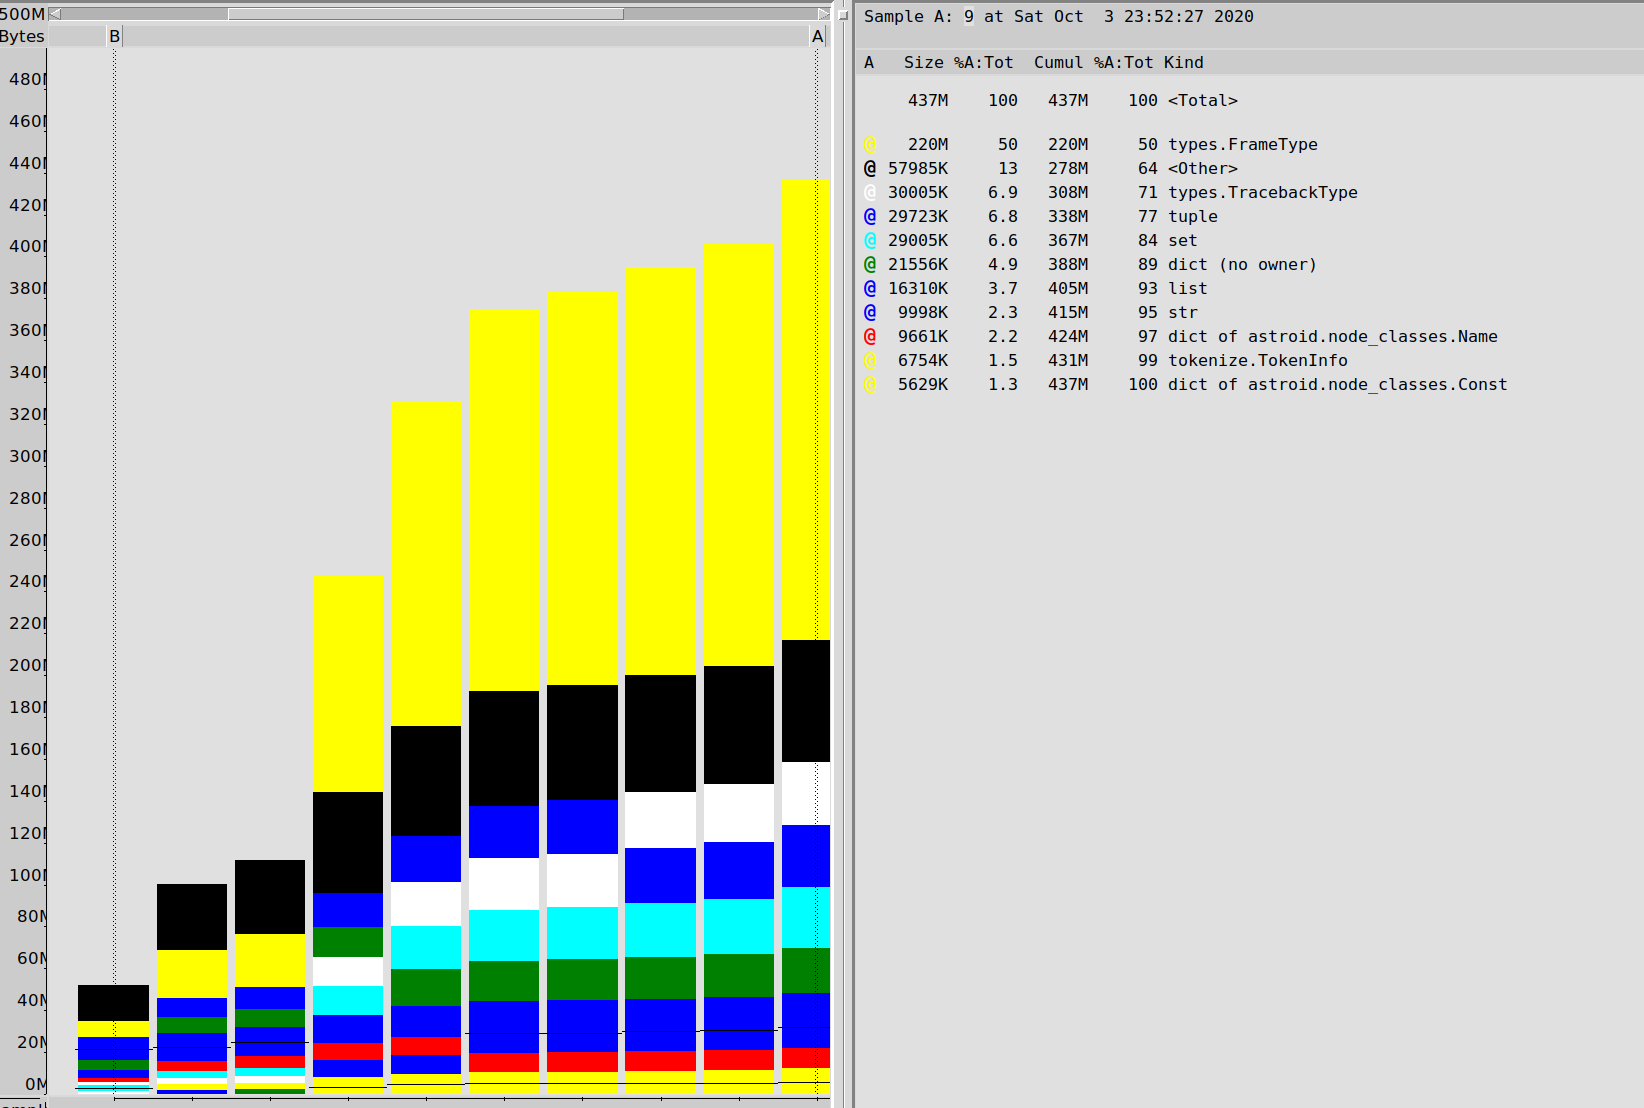
I switched up the heap mechanism to dump to a file every 10 iterations, then graph the entire runtime behaviour
#!python
for name, filepath, modname in file_descrs:
    self._check_file(get_ast, check_astroid_module, name, filepath, modname)
    i += 1
    if i % 10 == 0:
        hp.heap().stat.dump("/tmp/linting.stats")
    if i == 100:
        hp.pb("/tmp/linting.stats")
        raise ValueError("Done")
I get the following result, confirming that frames and tracebacks are a big deal in this run of Pylint:
My next step is to actually look at the frame objects. Because Python is reference coutned, things are held in memory because something is pointing at them, so I'm going to try and find out which one.
The wonderful objgraph library takes advantage of the Python memory manager to let you look at all objects still in memory, as well as lookup references to an object.
It's actually very amazing that you can do this. Just have an object reference and you can find everything pointing towards that reference (there's some asterisks around C extensions but close enough). This is just wonderful technology for debugging, and another thing that makes Python a joy to work with, thanks to how much of CPython's internals are exposed for these kinds of tools.
First I struggled to find objects because objgraph.by_type('types.TracebackType') wasn't finding any objects, despite me having records of having half a million of them. Turns out the name to use was traceback. Didn't quite nail down why...
#!python
 random.choice(objgraph.by_type('traceback'))
Gives me a "random traceback". objgraph.show_backrefs will draw a graph of objects referencing this traceback.
So I put an import pdb; pdb.set_trace() into the for loop after 100 iterations instead of just raising an exception, and I started looking at random tracebacks
#!python
def exclude(obj):
    return 'Pdb' in str(type(obj))

def f(depth=7):
    objgraph.show_backrefs([random.choice(objgraph.by_type('traceback'))],
                            max_depth=depth,
                            filter=lambda elt: not exclude(elt))
Originally I was just seeing a chain of tracebacks, so I went for a depth of 100 and....
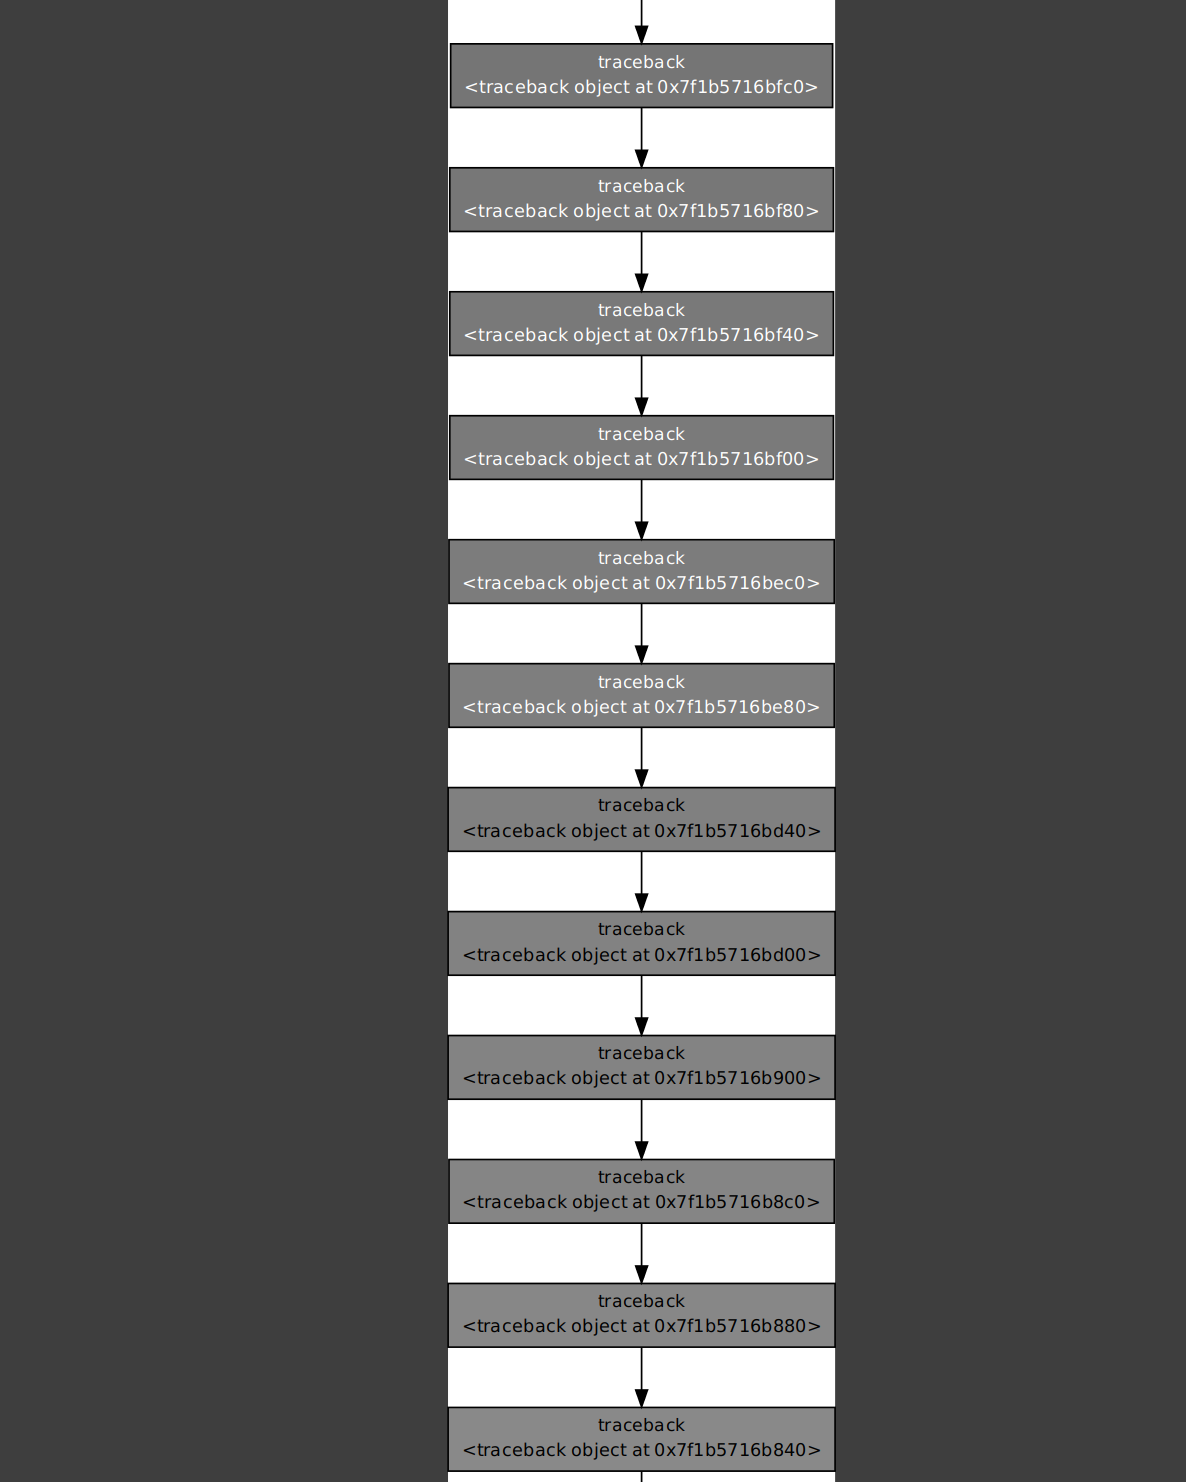 So a bunch of tracebacks referencing other tracebacks. Cool. So many of them were like this.
I ended up just trying a bunch and failing, so I went after a secondary target: the frame types. These also seemed suspicious to me, and whatI end up finding is something like the following:
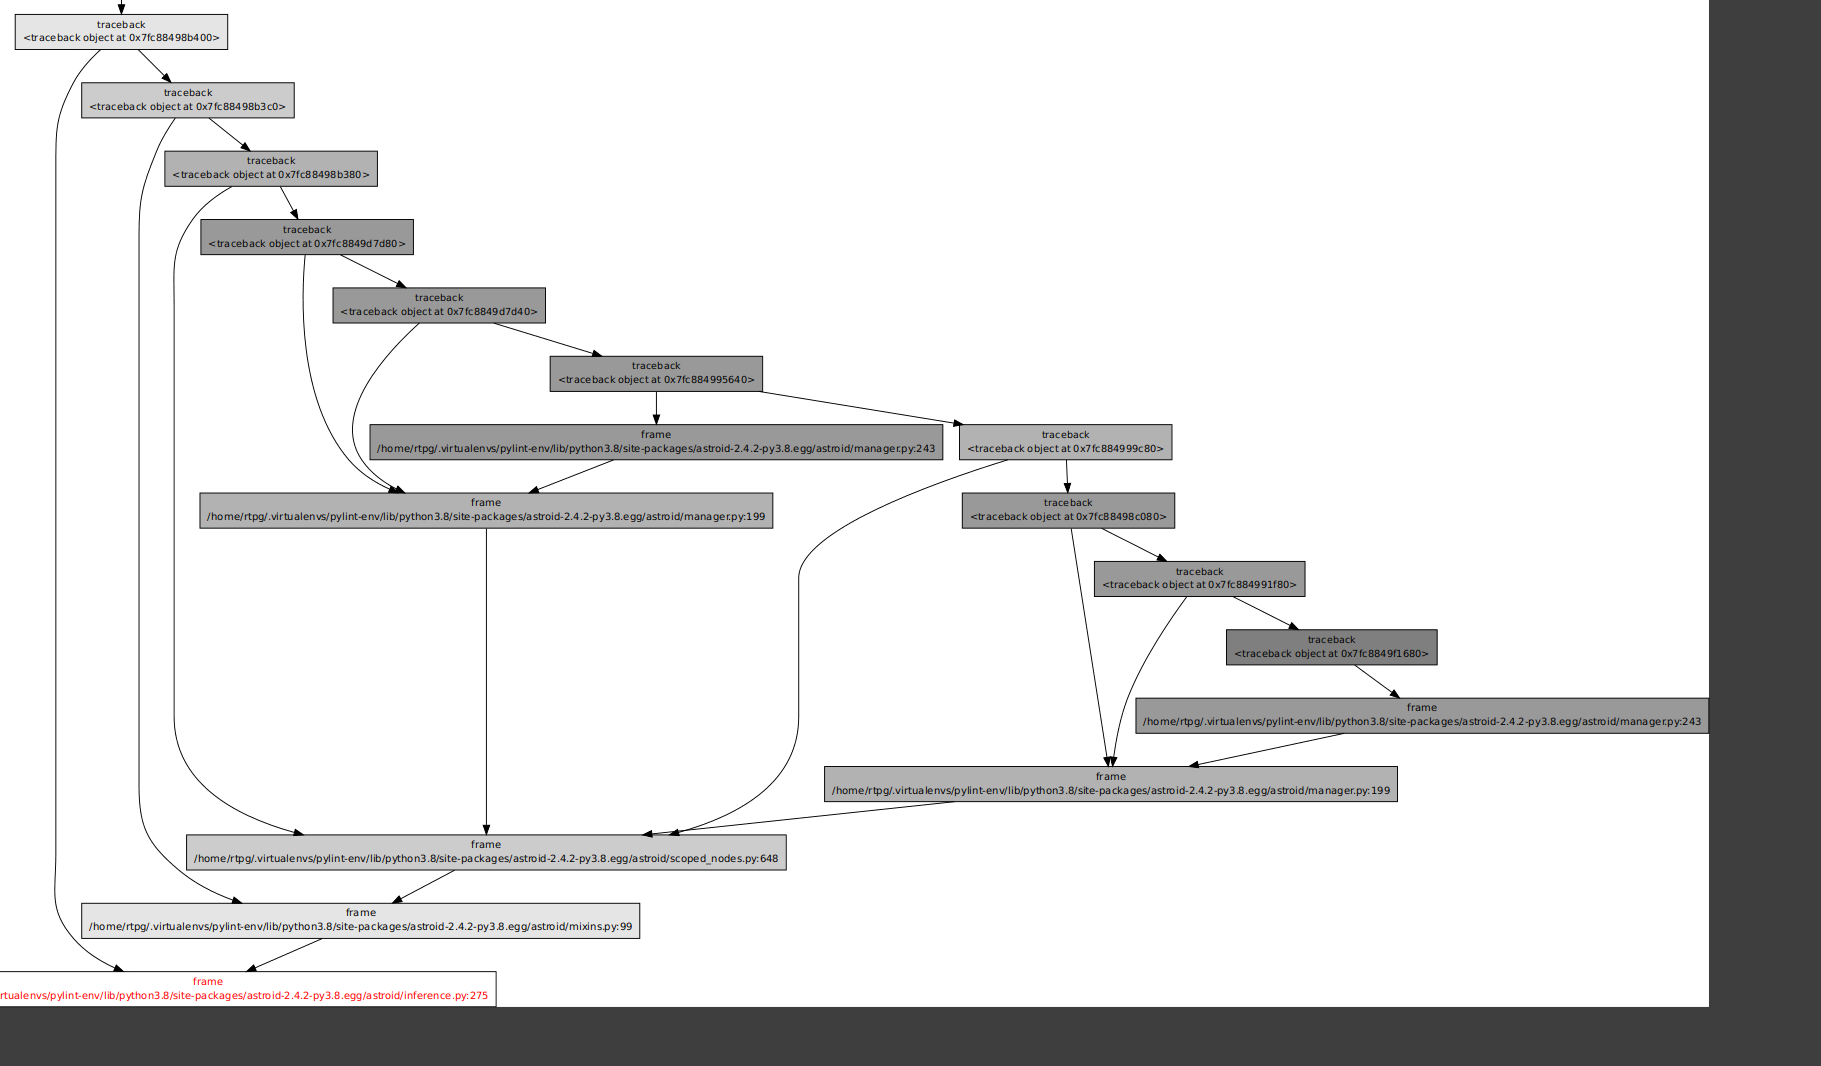
So tracebacks are holding onto frames (hence some similar cardinality). It's all a big mess, but the frames were at least pointing to lines of code. And this made me realize something silly: I had never bothered to actually look at the data using up so much memory. I totally should have just looked at the traceback objects themselves.
So for this I ended up doing this in the most convoluted way possible, which is look at the addresses in the objgraph image dump, seeing the memory addresses, searching the web for "how do I get a Python object from its address" and ending up finding the neat trick that I had noted:
#!python
ipdb> import ctypes
ipdb> ctypes.cast(0x7f187d22b880, ctypes.py_object)
py_object(<traceback object at 0x7f187d22b880>)
ipdb> ctypes.cast(0x7f187d22b880, ctypes.py_object).value
<traceback object at 0x7f187d22b880>
ipdb> my_tb = ctypes.cast(0x7f187d22b880, ctypes.py_object).value
ipdb> traceback.print_tb(my_tb, limit=20)
You can just tell Python "hey look at this memory, it's definitely at least a python object" and it will work.
Later I realized I had references to these objects through objgraph and could just use that.
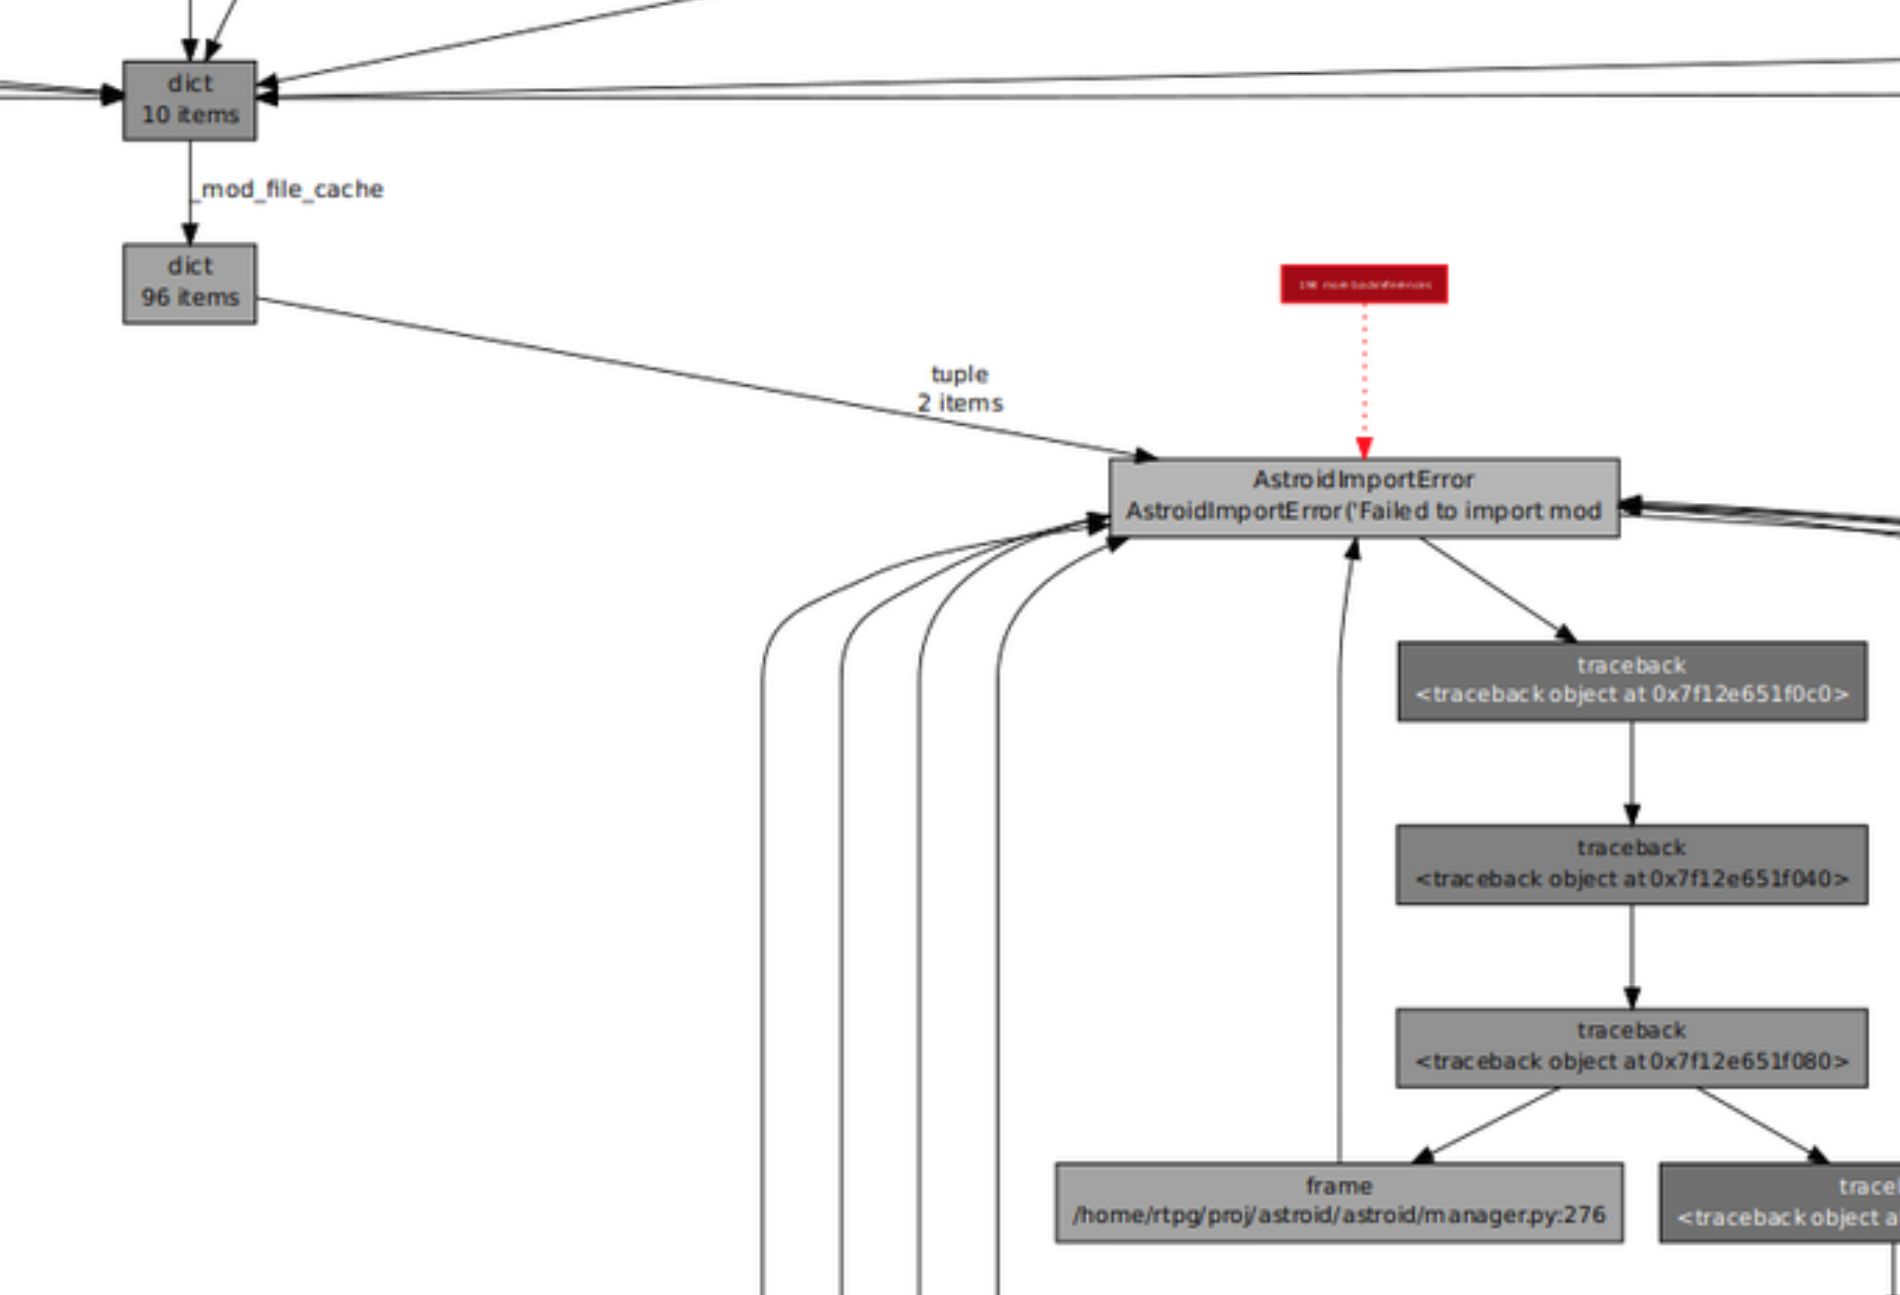
It looks like Astroid is building up tracebacks through exception handling code a bit all over the place. I feel like most "cool tricks" are gotten to by forgetting about the easy way to do something, so I won't complain too much.
The traceback itself had a bunch of lines going through Astroid, the AST parser backing Pylint. Progress! Astroid does seem like a program that might hold onto a lot of stuff in memory as its parsing files.
I look around and end up seeing the following line in astroid/manager.py
#!python
except Exception as ex:
    raise exceptions.AstroidImportError(
    "Loading {modname} failed with:\n{error}",
    modname=modname,
    path=found_spec.location,
) from ex
"Aha!" Itell myself. This is what I'm lookign for! Some sort of exception chain that would generate super long tracebacks. Plus it's file parsing so there's reccursion, etc... raise thing from other_thing would chain them together!
I remove this from ex and .... nothing. Memory usage is still basically the same, and the tracebacks are still here.
I remember that exceptions hold their local bindings in the tracebacks, so the ex is still accessible. It can't be garbage colleceted just yet!
I do a bunch of refactorings to try and remove the except block for the most part, at least to avoid the reference to ex. Again, nothing!
For the life of me I can't get these tracebacks to garbage collect, despite there being no references to them. At least I thought this was the remaining reference.
Really though, this was all a red herring. I don't know if this actually had anything to do with my memory leak, because at one point I started noticing that I had no evidence backing up this entire exception chaining theory. Just a bunch of hunches, plus half a million tracebacks.
I started just kind of randomly looking at tracebacks looking for any extra clues. I tried going up the chain of references by hand but was getting nowhere.
Then I had the revelation: these tracebacks are all stacked on top of each other, but there will be a traceback that is above all these other ones. There is a traceback that doesn't just have another traceback pointing to it!
the references were through the tb_next property, as a simple chain. So I decided to look for the tracebacks at the end of their respective chains:
bottom_tbs = [tb for tb in objgraph.by_type('traceback') if tb.tb_next is None]
There's something magical about one-lining your way through 500,000 stack traces to find the one you actually care about.
This led me to what I was actually looking for: the reason why Python really wanted to keep these objects around in the first place.
 We had a file cache!
Basically Astroid will cache the results of loading a module, so that if some part of the code asks for the same module/file again, it can just provide the previous result. It will also reproduce the errors as well, by holding onto thrown exceptions.
This is where I made a bit of a judgement call. Caching the "error-ness" makes sense, but for me it's not at all worth holding onto the number of tracebacks our code is generating.
Instead I decided to throw away the exception, store a custom Error class, and then just re-building exceptions when they are asked for. The details can be found over at this PR, though it's not super interesting.
The end result: we went from 500MB memory usage to 100MB for the codebase I was working against
 80% improvement's not bad, if I do say so myself.
The PR itself, I'm not sure if it will actually get merged though. It's not purely a performance change, and I think it could make stack traces less useful in some scenarios. It's a pretty brutal change all things considered, even if the test suite still passes.
Overally, I came away with the following:
- The memory visibility in Python is pretty amazing, and I should be using it more often when debugging.
- Back up the theories with evidence, not just hunches.
- Write down the "current objectives" so you don't completely lose the plot while debugging. This took me a couple hours in the end and I went down way too many rabbit holes that were not realated to my actual issue.
- Saving your WIP snippets (or even better: committing to Git) is super useful. It might be tempting to just delete stuff, but you might need to look up how you got a result later on, especially for more performance-oriented work.
One thing that made me smile though; while writing this retrospective, I realized I had already forgotten so much of how I got to certain conclusions, so ended up re-testing some of my snippets. I then ran my measurements on an unrelated codebase and found that the weird memory usage only happened on one codebase. I had spent a bunch of time debugging this issue, but it's extremely likely that it's just pathological behaviour that's hitting only a minority of users.
Even when you do all these measurements, it's always very hard to make blanket statements about performance.
I will be trying to take this experience to other projects as well. My theory is that there's a lot of low hanging fruit in performance-related questions for open-source Python projects, given that the community has relatively little focus on that space (beyond the "libraries that are just C extensions" class of projects).