Trying To Make Pylint Faster
Last time I spent some time digging into Pylint, I was able to identify some memory issues, but hadn't really changed the runtime of Pylint. This time around I'm going to see if I can identify something that I can make actually run faster, instead of just using less resources.
My Personal Profiling Principles
Function f is taking some time. You have the following options:
- find a way to make all calls to it faster (or at least the same)
- find a way to make some calls to it faster, while making other calls to it slower
- find a way to not call it as many times
You also have:
#!text
total time in f = (number of calls to f) * (average time in f)
If you want to reduce f's runtime, you'll need to somehow reduce one of the values on the right.
And really "total time in f" can depend on the kind of workload here too, so "make f faster" also can involve some tradeoffs depending on the workload. So in the end having some knowledge of how some code is used can go a long way in making the right kind of decisions.
The other principle is that a computer basically does, like, three things:
- I/O (I include memory access in this), so basically "waiting for information"
- comparing things
- adding things together
So if you want to make something faster, a good trick is to either: - need less information - compare less stuff - add less stuff
This is all "do less stuff", of course, but these points are useful as an idea generator.
Measuring Performance
To start off with trying to get Pylint faster, I'll first need to set up some measurements. Normally I would just pull out cProfile to get some profiling information as a first step, but I took this opportunity to try out some other tools.
functiontrace is a neat little library from Mozilla that will let you profile Python (with, apparently, very good threading support and the like) and has a great little collection interface. It collects a bunch of information in the process.
Seeing the really nice screenshots and the pitch for things, I decided to give this a whirl:
#!python
import functiontrace
functiontrace.trace()
and you're off to the races!
I ran a small Pylint load checking 100 files or so and the tracing server spit out the following line:
#!text
[FunctionTrace] Wrote profile data to
/home/rtpg/proj/thing/functiontrace.2020-10-27-22:50:34.543.json (1.2 GB)
That's.... a lot of data. Guess this is what happens when you don't do any sampling at all!
The profile data is meant to be consumed by the Firefox Profiler. So I try uploading this, but the interface outright fails. I'm not really sure what went on, I tried a couple different times.
My best guess is that the size was the issue here, so I re-ran the traces with a much smaller slice of data
#!text
[FunctionTrace] Wrote profile data to
/home/rtpg/proj/thing/functiontrace.2020-10-27-22:59:06.106.json (107.7 MB)
This was able to load, and I was presented with a very neat interface (that was having a bit of trouble keeping up with UI events...).
This looks like a lot of the web development profiling tools built into browsers, and it is a lot of information, but ultimately I wasn't really able to deduce much from this. I couldn't even figure out how to just get function call counts in here, and given how many functions were being called I couldn't really find great entrypoints.
Like it looks soooo cool! But I was missing stuff, it was really slow.... I don't really know what I could do with the information so gave up
One day I'll have a use case for functiontrace, but for now, I decided to just use cProfile, which I've used in the past and, while not providing nearly as deep a picture of what's going on, gives me the information I care about, in a way I know how to read.
#!python
print("Beginning trace....")
import cProfile
prof = cProfile.Profile()
prof.enable()
with self._astroid_module_checker() as check_astroid_module:
    i = 0
    for name, filepath, modname in file_descrs:
        self._check_file(get_ast, check_astroid_module, name, filepath, modname)
        i += 1
        if i == 10:
            prof.disable()
            prof.dump_stats("latest.cprof")
            raise ValueError("Done")
So this basically starts profiling, looks at 10 files, then stops profiling and dumps the results into a file for later analysis.
Looking At The Results
There's a lot of ways to chop up the data and analyse it through sorting/filtering/printing in Python, but for me I end up pulling up Snakeviz, a browser-based viewer for profiling data that Just Works(tm) and has never really choked on me.
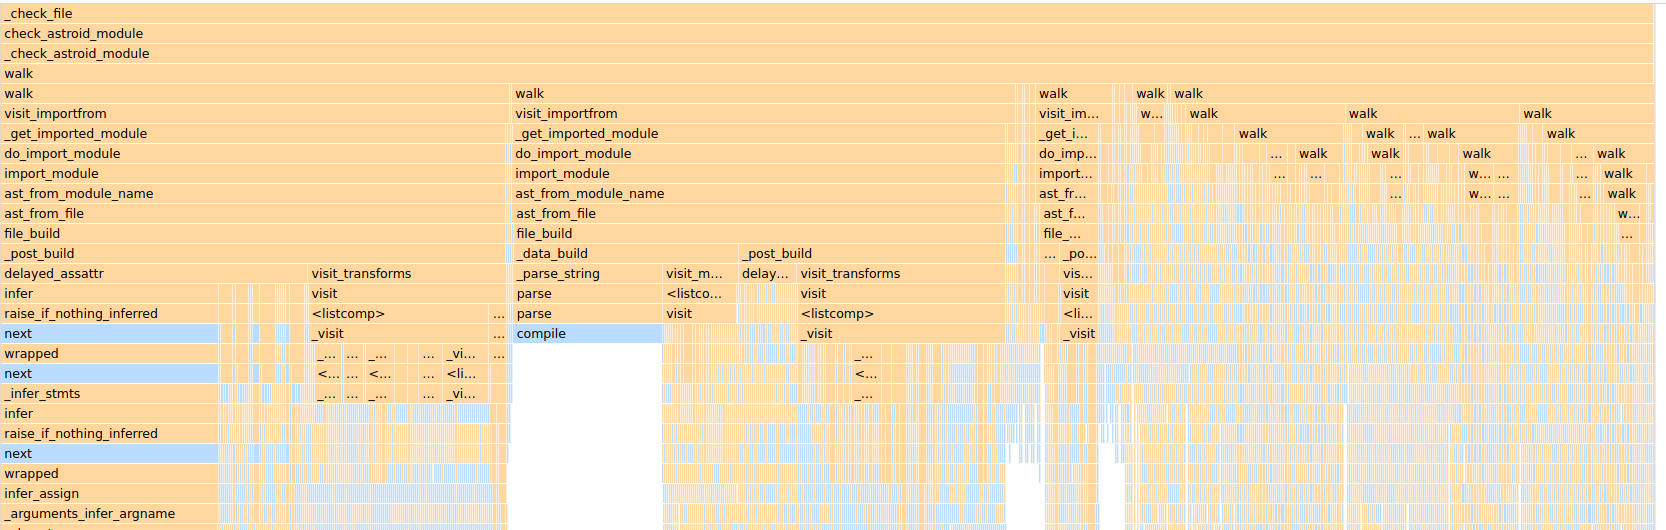
Just running snakeviz latest.cprof will give me a flamegraph, where clicking on specific functions will provide the statistics on those functions.
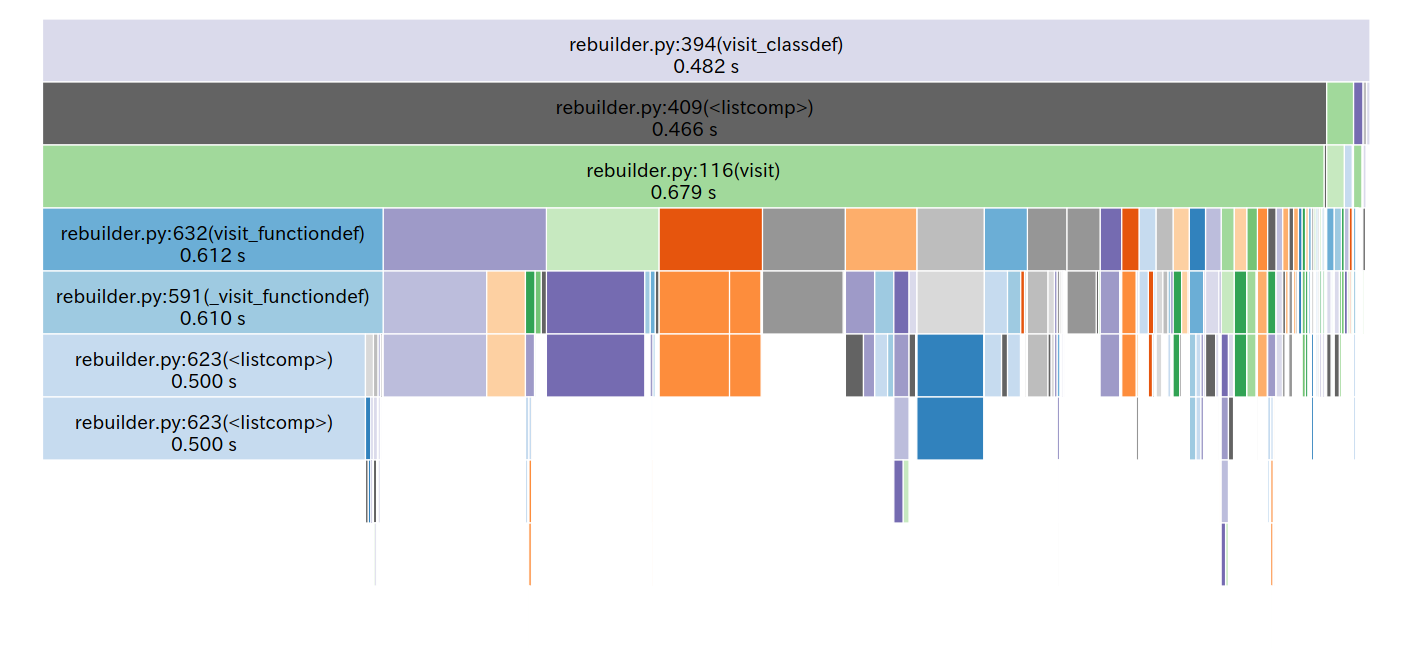
Sometimes you'll see things tha "bottom out", like these list comparisons in isit_classdef. So there you're likely looking at where a bunch of actual computing work (or "waiting for I/O") is happening.
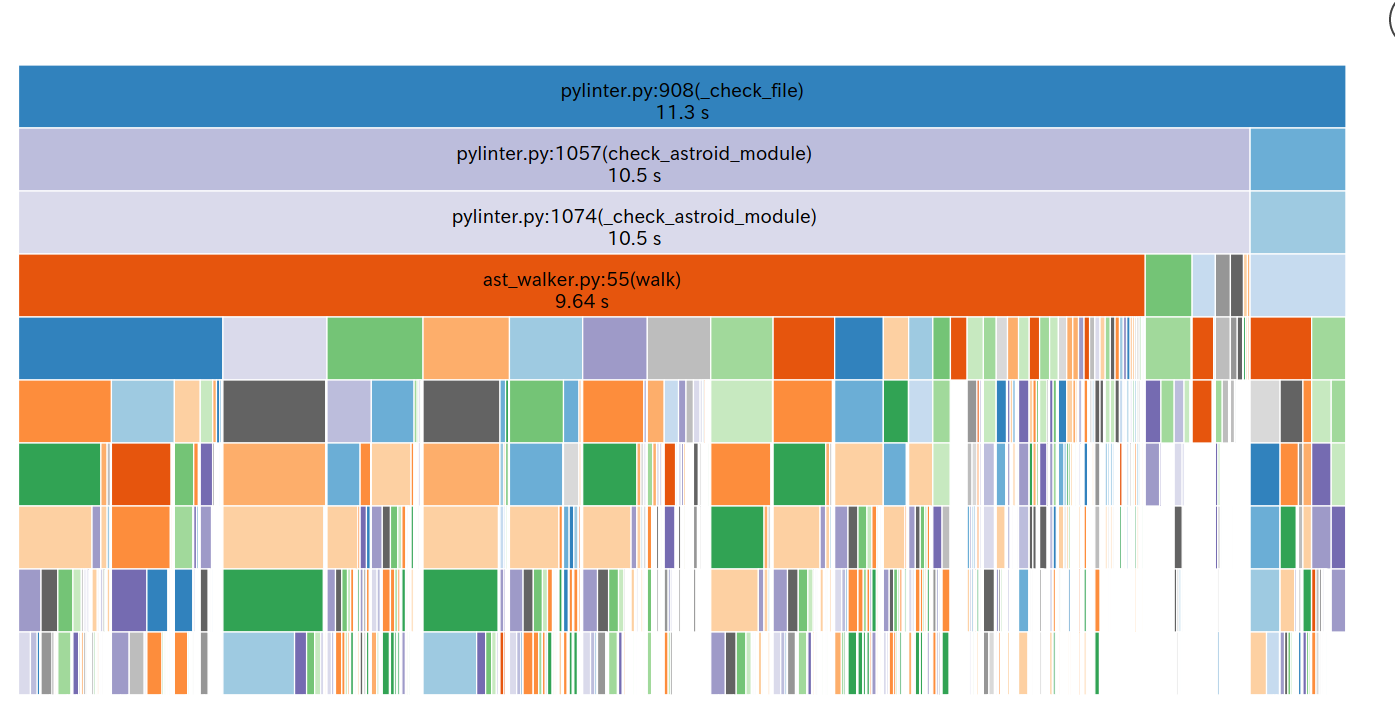
The list comparisons ended up basically not leading me anywhere, and seemed improtant to how Pylint traversed the AST, but clicking around I found another block that "bottomed out" and was a bit more surprising

People tell me regexes are fast, but this seemed to be taking up like 5% of the runtime! And on top of that given that Pylint supposedly builds up an AST and works off of that, kinda surprising to see a regular expression also be a signinificant tool.
Digging a bit deeper in here, I found that check_lines is in fact the function that checks line lengths and endings. This function ends up getting called on basically every line of Python code. So in one sense it makes sense for it to show up. But on the other hand, if we're going to call something this many times we better make sure it's fast!
Digging in a bit, the regular expression being called was the following absolute unit:
#!python
# Allow stopping after the first semicolon/hash encountered,
# so that an option can be continued with the reasons
# why it is active or disabled.
OPTION_RGX = r"""
    \s*                # Any number of whithespace
    \#?                # One or zero hash
    .*                 # Anything (as much as possible)
    (\s*               # Beginning of first matched group and any number of whitespaces
    \#                 # Beginning of comment
    .*?                # Anything (as little as possible)
    \bpylint:          # pylint word and column
    \s*                # Any number of whitespaces
    ([^;#\n]+))        # Anything except semicolon or hash or newline (it is the second matched group)
                       # and end of the first matched group
    [;#]{0,1}"""  # From 0 to 1 repetition of semicolon or hash
OPTION_PO = re.compile(OPTION_RGX, re.VERBOSE)
This regular expression lets us find any pylint pragmas (# pylint: disable=bad-builtin for example) so that we can check for any disabled errors or the like inside of a line (or the top of a file). This is how you can tell Pylint to ignore an error on a line.
At first I was thinking "oh, well I can get the regex to be faster by mandating the # symbol". In the current format the regex has to try a bunch of different combos because of all the optional/wildcard mechanisms (so the regex has no great way of bailing out early).
Mandating the # at the begining of the regex cut down the time in half! But... it didn't actually work. In my target codebase I was using pylint warnings to catch some stuff, and now it was failing. And the Pylint test suite itself started failing, so I was clearly extremely offbase in trying to mess with this regular expression.
At this point I decided that it was no longer time to just tweak little parts of a regex to try and get faster code with equivalent semantics. I decided it was time to try and understand the code.
Digging Deeper
I decided to dig a bit deeper in the check_lines function itself, to figure out how this was being used.
Pylint lets you check for line lengths. For example if you have set a line limit of 40 characters then
#!python
def calculate_result():
    return get_sheep_velocity() * time_until_snakes_arrive()
will hit an error on the line with a return because the line is over 40 characters.
So far so good, right? But! there are some exceptions to whether that line will fail. For example, you can tell Pylint to ignore a certain error with a disable pragma
#!python
    return get_sheep_velocity() * time_until_snakes_arrive() # pylint: disable=line-too-long
So in the case you have disabled the line length error, you won't hit an error despite the length being long.
There's another exception to the line length check as well: a line being long only because of Pytlint pragmas will not get flagged. For example
#!python
def debug():
    if DEBUG_ENABLED:
        import pdb; pdb.set_trace() # pylint: disable=multiple-statements
The line, if there are no pragmas, does not hit our 40 character limit. So Pylint won't flag this line.
The rough code for the line length check thus looks like:
#!python
def process_line(line):
    # first let's get our pylint pragmas
    # (this is where the regex ends up getting called)
    pragmas = get_line_pragmas_via_regex(line)
    stripped_line = stripe_line_pragmas_via_regex(line)
    should_check_line = 'line-too-long' not in pragmas
    return stripped_line, should_check_line

def check_line(self, line, max_line_length):
    stripped_line, should_check_line = process_line(line)
    if should_check_line:
        if len(stripped_line) > max_line_length:
            return 'line-too-long'
        else:
            return None
So we end up in this pickle. A supposedly simple len check gets tricky because we have to process the line for pragmas first. And on top of that it feels a bit silly because this seems to be a lot of effort for handling exceptional cases.
So... is there a way for us to somehow simplify this check down to if len(line) > max_line_length with some cleverness? Well... not really. A spec is a spec, and if you need to check a line for pragmas, or strip them out, that work is present.
However, this is where you can start thinking about what kind of data you're feeding this program. Imagine the 80-character line length limit. Or (more often) the 100 or 120 line limit length. How many lines do you write in a day that hit that limit? Likely more than zero, but, especially for Python, probably not that many.
In fact, you could open a random file and spot-check most of it very quickly! You could open, draw a vertical line, and have almost no line cross it. Especially if you are running Pylint in CI and are meant to have no errors anyweays.
The lines that need more scrutiny.... are the exceptional lines!
Here's an example distribution of line lengths for python files in a project I'm looking at
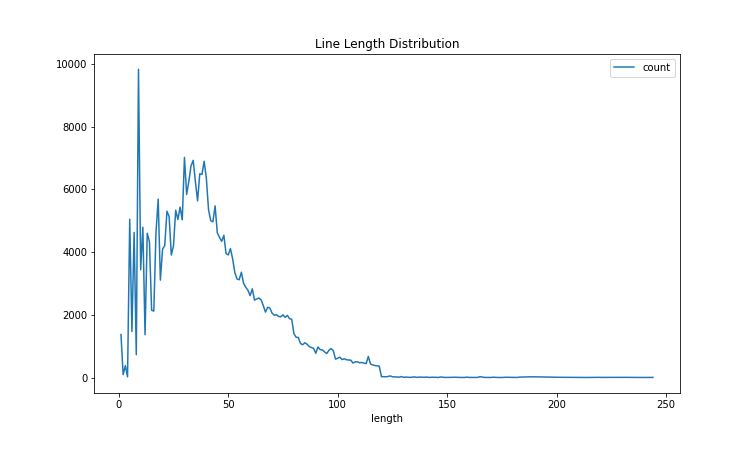
(this project has a 120 line length limit) so many lines are just extremely under the limit, and this is without even considering stripping.
Fast Check, Slow Check
Given that so many lines clear the line limit without any fancy checking, we'll try to opt for no fanciness unless we need it. Basically, making a bet that most lines will just be short.
#!python
def check_line(self, line, max_line_length):
    # fast check
    if len(line) < max_line_length:
        # the line is short enough without stripping or pragma checks
        return None
    # slow check
    stripped_line, should_check_line = process_line(line)
    if should_check_line:
        if len(stripped_line) > max_line_length:
            return 'line-too-long'
        else:
            return None
Now one might notice that this is actually adding work for lines that will hit the line-too-long error, in the form of the length check.
Intuitively speaking, when looking at code, you're rarely hitting line length limits. And this might even really be a general rule for Pylint checks! You're rarely hitting failures if you're running your checks in CI, since you're usually working off of a codebase that has no errors on the main branch.
Fortunately getting the length of a string is very quick work compared to running it through that very complex regex. For my reference codebase, only 0.18% of lines hit the naive line limit check and would require extra work. So the other 99.82% could get a much faster check.
So here, we have tricky exceptional cases that are empirically exceptional, a "fast check" that can quickly handle the common case in a much faster way than before, and the full check can remain in place as-is so that we don't have to change the final semantics of the check.
The actual code is a bit trickier, and there's an ongoing pull request to try and get it merged, but the results are pretty great, and have been met with enthusiasm.
The entire line checking process step went from ~5% of the runtime to 0.3% of the entire runtime. It's still visible in the profile traces but much less evident. And it required only a pretty localised change.
Lesssons
My general profiling strategy has been to set up measurements, try and quickly pinpoint an improvement point, and focus on that. I think that this sometimes backfires, but identifying something that is self-contained (didn't require a refactor across multiple parts of the codebase) let me really pull out some non-controversial improvements.
When first looking at the profiling data though, I digged through parts of the system that were simply taking a long time (notably the AST walkers). Those tended to, themselves, call a bunch of functions and take up a huge part of the runtime.
I should have more quickly identified that these functions in themselves were not very self-contained if I wanted to find low-hanging fruit. Reaching for things with deep call stacks can be tempting, but essentially shallow call stacks will probably be more self contained. Those will likely have the lower hanging fruit.
At first I spent some time trying to tweak the regex to make it faster, instead of looking at how it was used and understanding that. Constantly measuring my changes and constantly running the test suite let me quickly identify that the strategy wasn't offering much of a payoff, and would not be super easy to pull off.
But at one point you have to start understanding the code. You can stare at a list comprehension and try to generate semantically-equivalent-but-faster code, but sometimes absorbing the context and making some changes to control flow will get you the performance wins you need without trying to do some bit twiddling magic.
But the big thing for me was to consider that making something faster doesn't necessarily involve making something faster for all use cases. If we have a strong justification behind it, building out fast paths for common cases can provide loads of wins. But you need to confirm what is common and what is exceptional. It's super dependent on how the code gets run.
When writing the patch itself, I found that writing out explanations for the changes helped to identify whether the patch was clear or not. I ended up changing some code to make it clearer (if a bit slower), and based on feedback from Pylint maintainers did another "clarity over performance" change.
I do think that the goal isn't performance at all costs. You can try relying on your test suite to make sure a "high performance but complicated" implementation is good, but hey, bugs in production get through test suites right? I got a bunch of performance wins but was ready to pay a bit in perf to get something that I could explain and that I was more confident in than my initial patch. If it's clear at least it's less likely to have weird bugs or edge cases.